NSW · Greater Sydney · Suburban
Liverpool City Council
A zone sets what may be built on the land — houses, apartments, shops, industry — and what may not. The zoning of Liverpool City Council, drawn from NSW’s own Land Zoning Map: every zone, where it applies and how much land it covers.
22% of Liverpool City Council is zoned residential.
Zoned by the Liverpool Local Environmental Plan 2008 and State planning policies
Zoning map
Every zone, from NSW’s own map
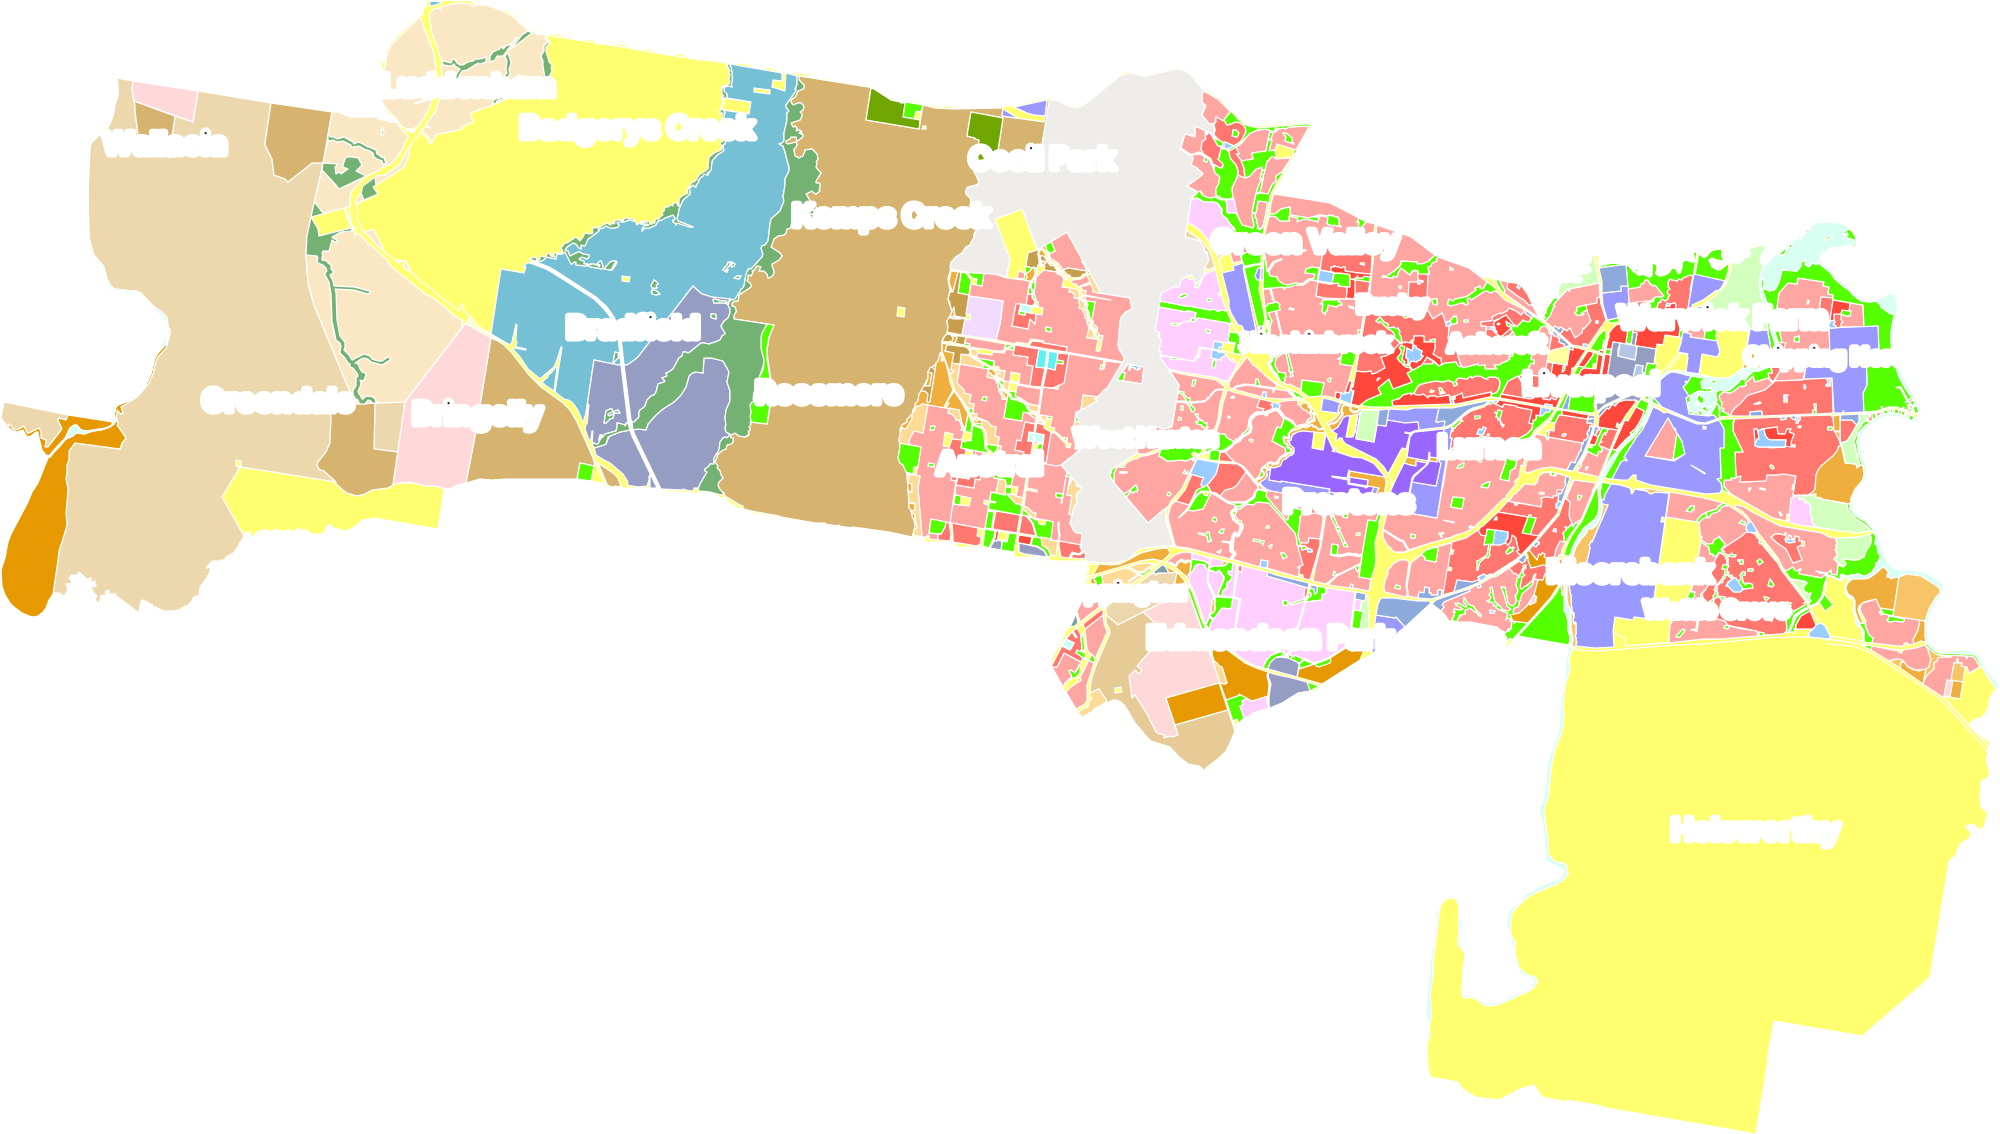
34 zones and the land each covers
Residential6,301 ha22%
- R1 General Residential553 ha1.9%
- R2 Low Density Residential3,518 ha12%
- R3 Medium Density Residential1,362 ha4.7%
- R4 High Density Residential312 ha1.1%
- R5 Large Lot Residential556 ha1.9%
Employment and mixed use3,165 ha11%
- B1 Neighbourhood Centre11.3 haunder 0.1%
- B2 Local Centre9.4 haunder 0.1%
- B4 Mixed Use37.3 ha0.1%
- B5 Business Development3.7 haunder 0.1%
- E1 Local Centre81.6 ha0.3%
- E2 Commercial Centre12.3 haunder 0.1%
- E3 Productivity Support123 ha0.4%
- E4 General Industrial896 ha3.1%
- E5 Heavy Industrial234 ha0.8%
- ENT Enterprise1,136 ha3.9%
- IN2 Light Industrial40.6 ha0.1%
- MU Mixed Use509 ha1.8%
- MU1 Mixed Use72.1 ha0.2%
Special purpose9,061 ha31%
- SP1 Special Activities11.2 haunder 0.1%
- SP2 Infrastructure9,050 ha31%
Recreation2,140 ha7.4%
- ENZ Environment and Recreation492 ha1.7%
- PRR Public Recreation - Regional70.4 ha0.2%
- RE1 Public Recreation1,360 ha4.7%
- RE2 Private Recreation218 ha0.7%
Rural7,088 ha24%
- AGB Agribusiness993 ha3.4%
- RU1 Primary Production2,924 ha10%
- RU2 Rural Landscape207 ha0.7%
- RU4 Primary Production Small Lots2,914 ha10%
- RU6 Transition51 ha0.2%
Conservation981 ha3.4%
- C1 National Parks and Nature Reserves454 ha1.6%
- C2 Environmental Conservation271 ha0.9%
- C3 Environmental Management98.4 ha0.3%
- C4 Environmental Living158 ha0.5%
Waterways314 ha1.1%
- W1 Natural Waterways314 ha1.1%
- No zone on NSW’s map1,528 ha
Where it comes from
The plans that zone Liverpool
- Liverpool Local Environmental Plan 2008The council's local environmental plan75%
- State Environmental Planning Policy (Precincts—Western Parkland City) 2021A State planning policy25%
A planning proposal under way can change this map. See Liverpool’s planning proposals.
The latest changes NSW published to the map
- Liverpool Local Environmental Plan 2008 — Map Amendment No 1022 Sept 2026
- State Environmental Planning Policy (Precincts—Western Parkland City) Amendment (Leppington Town Centre) 202626 June 2026
- State Environmental Planning Policy (Precincts—Western Parkland City) Amendment (Emergency Facility) 20258 Aug 2025
- Liverpool Local Environmental Plan (Precincts – Western Parkland City) (Map Amendment No 4)25 July 2025
- State Environmental Planning Policy (Precincts—Western Parkland City) Amendment (Exempt Development) 202511 July 2025
- Liverpool Local Environmental Plan (Precincts – Western Parkland City) (Map Amendment No 3)17 Apr 2025
Every lot’s controls
Across NSW, 0.7% of the zoned land is residential.
Lodgd holds the zone, height limit, floor space ratio and heritage of every lot in NSW — beside the development applications, CDCs and building certificates on it, and the homes each council’s zoning already allows.
Try the free demo →Measured over the zoning maps of all 128 councils: 70,858,225 hectares zoned, 482,381 of them residential (zones R1 to R5).
Of every hundred hectares NSW’s councils have zoned, this much is zoned residential.
Elsewhere in NSW
Zoning in other councils
How the system works. How land is rezoned · Transport-oriented precincts · All guides →
How we measure. Every zone NSW’s Land Zoning Map draws in Liverpool City Council — the council’s own plan, and the land State planning policies zone directly — as NSW publishes it. Areas are measured from NSW’s outlines; shares are of the land NSW’s map zones, waterways included. Zoned residential means zones R1 to R5, and the older residential zones a few State policies still use.