NSW · South East and Tablelands · Regional
Queanbeyan-Palerang Regional Council
A zone sets what may be built on the land — houses, apartments, shops, industry — and what may not. The zoning of Queanbeyan-Palerang Regional Council, drawn from NSW’s own Land Zoning Map: every zone, where it applies and how much land it covers.
0.5% of Queanbeyan-Palerang Regional Council is zoned residential.
Zoned by the Queanbeyan-Palerang Regional Local Environmental Plan 2022
Zoning map
Every zone, from NSW’s own map
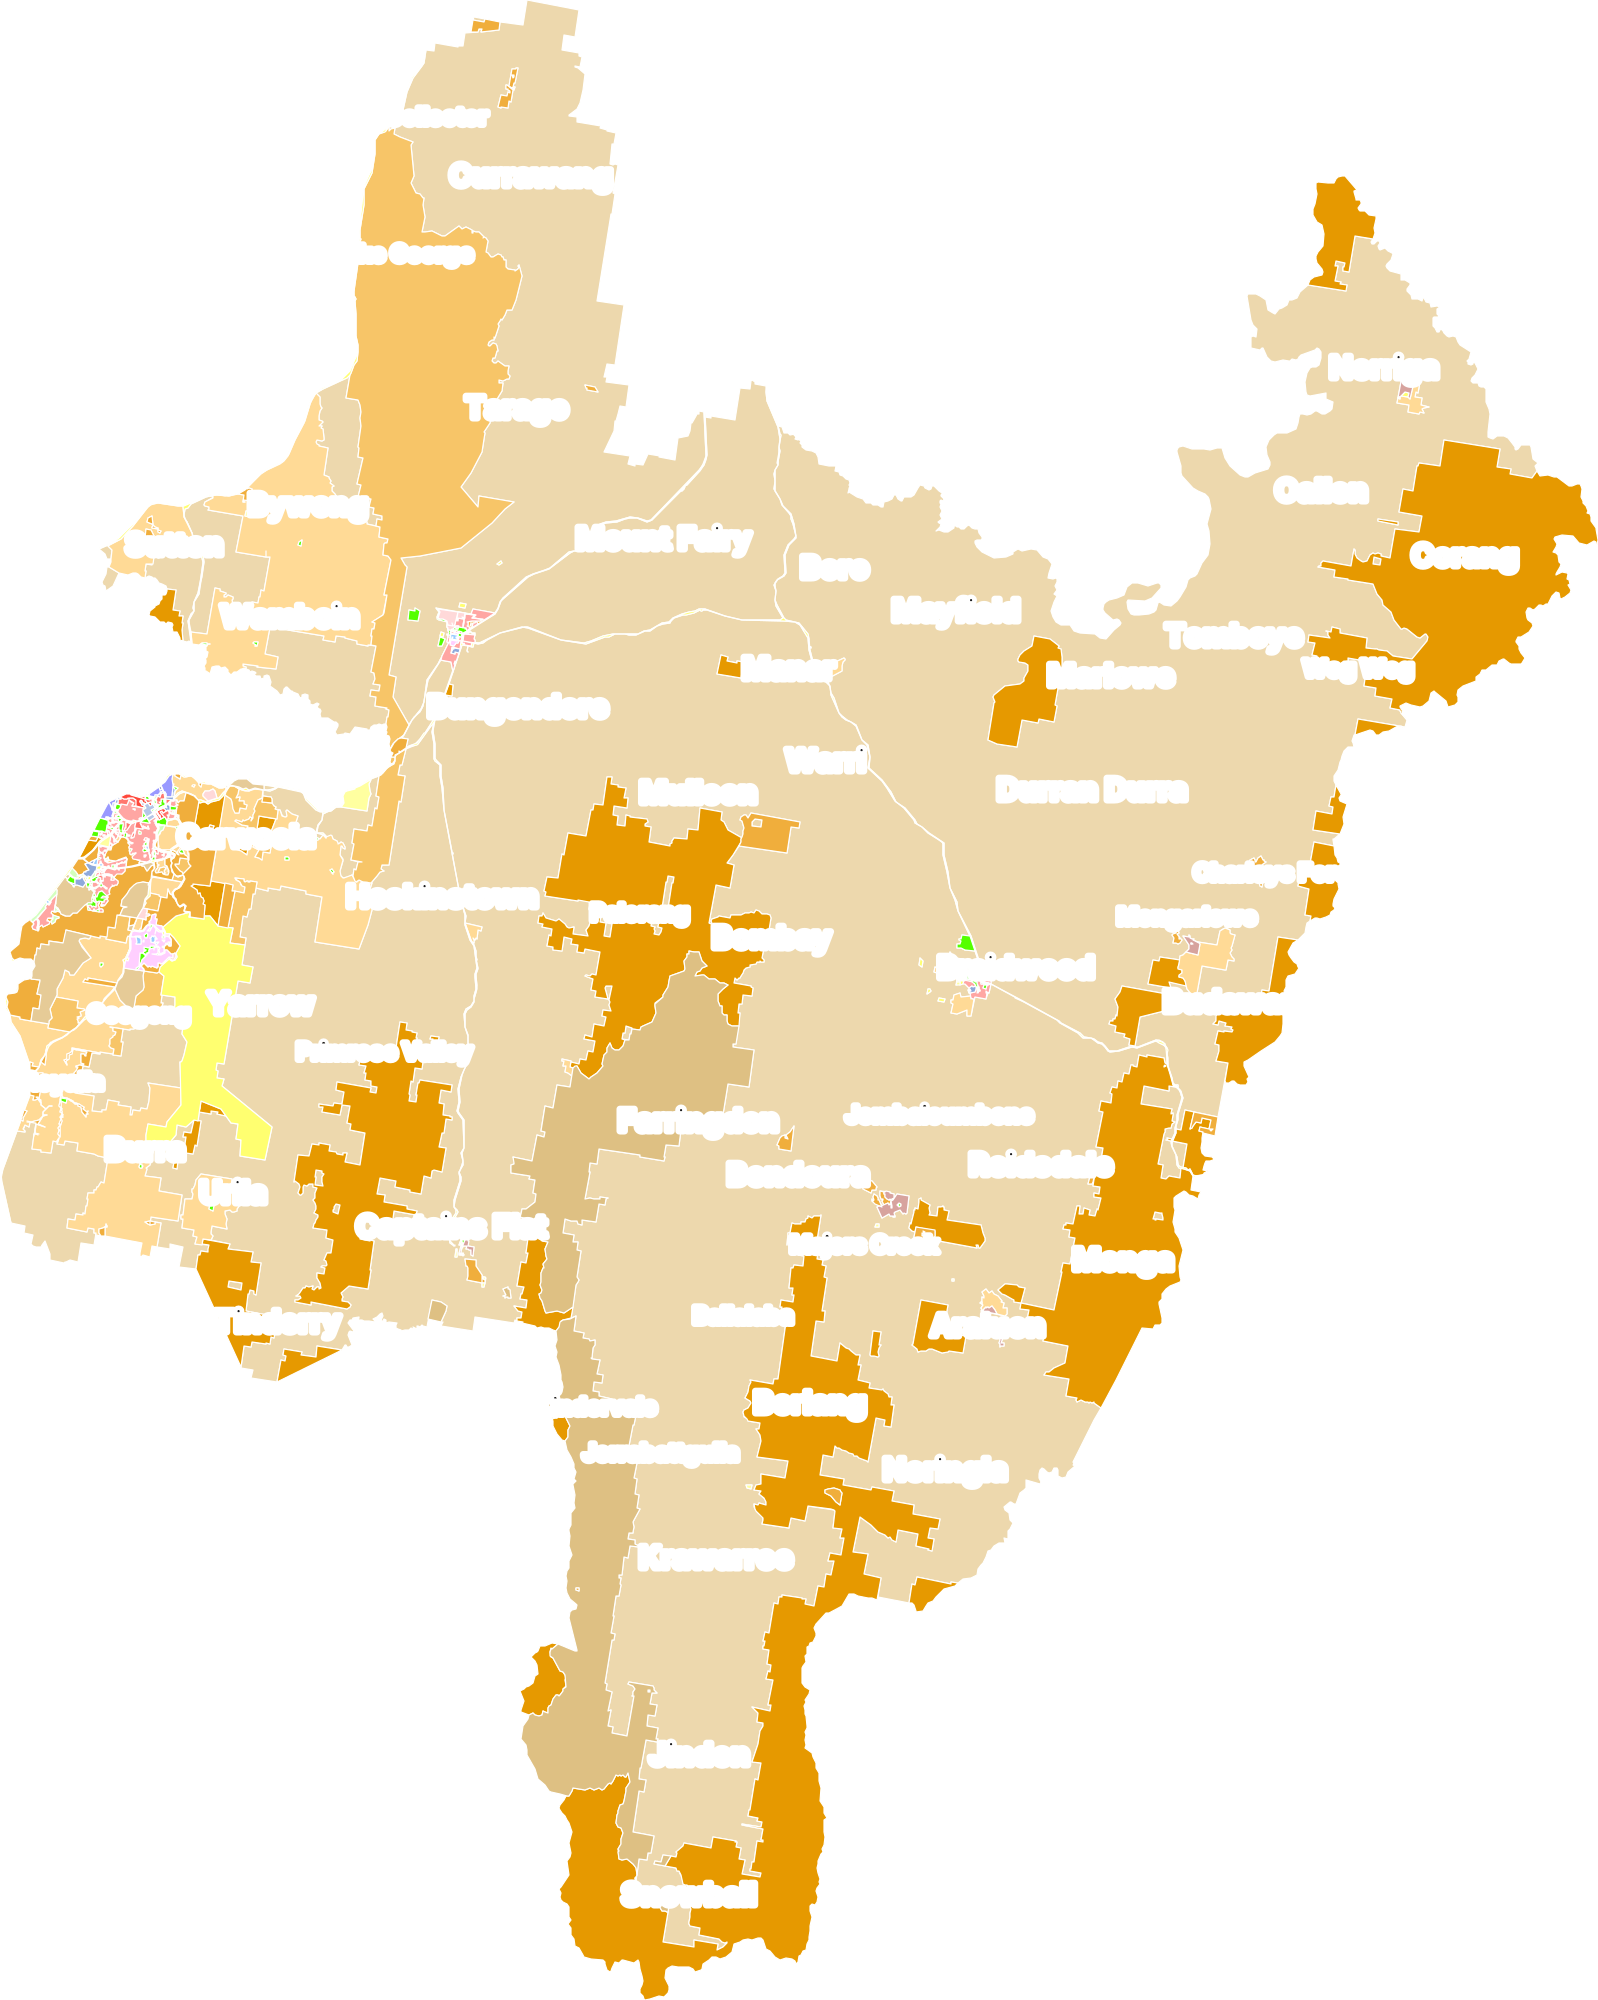
23 zones and the land each covers
Residential2,501 ha0.5%
- R1 General Residential493 haunder 0.1%
- R2 Low Density Residential1,544 ha0.3%
- R3 Medium Density Residential185 haunder 0.1%
- R4 High Density Residential74.3 haunder 0.1%
- R5 Large Lot Residential205 haunder 0.1%
Employment and mixed use419 haunder 0.1%
- E1 Local Centre57.7 haunder 0.1%
- E2 Commercial Centre46.4 haunder 0.1%
- E3 Productivity Support145 haunder 0.1%
- E4 General Industrial147 haunder 0.1%
- MU1 Mixed Use22.5 haunder 0.1%
Special purpose6,922 ha1.3%
- SP1 Special Activities291 haunder 0.1%
- SP2 Infrastructure6,631 ha1.2%
Recreation893 ha0.2%
- RE1 Public Recreation745 ha0.1%
- RE2 Private Recreation148 haunder 0.1%
Rural382,325 ha72%
- RU1 Primary Production356,550 ha67%
- RU2 Rural Landscape2,018 ha0.4%
- RU3 Forestry23,333 ha4.4%
- RU5 Village424 haunder 0.1%
Conservation138,970 ha26%
- C1 National Parks and Nature Reserves84,278 ha16%
- C2 Environmental Conservation5,883 ha1.1%
- C3 Environmental Management22,407 ha4.2%
- C4 Environmental Living26,403 ha5%
Waterways34.4 haunder 0.1%
- W1 Natural Waterways34.4 haunder 0.1%
Where it comes from
The plans that zone Queanbeyan-Palerang
- Queanbeyan-Palerang Regional Local Environmental Plan 2022The council's local environmental plan100%
A planning proposal under way can change this map. See Queanbeyan-Palerang’s planning proposals.
The latest changes NSW published to the map
- Queanbeyan-Palerang Regional Local Environmental Plan 2022 — Map Amendment No 812 June 2026
- Queanbeyan-Palerang Regional Local Environmental Plan 2022 — Map Amendment No 724 Apr 2026
- Queanbeyan-Palerang Regional Local Environmental Plan 2022 — Map Amendment No 610 Apr 2026
- Queanbeyan-Palerang Regional Local Environmental Plan 2022 — Amendment No 96 Mar 2026
- Queanbeyan-Palerang Regional Local Environmental Plan 2022 — Amendment No 812 Dec 2025
- Queanbeyan-Palerang Regional Local Environmental Plan 2022 — Map Amendment No 416 May 2025
Every lot’s controls
Across NSW, 0.7% of the zoned land is residential.
Lodgd holds the zone, height limit, floor space ratio and heritage of every lot in NSW — beside the development applications, CDCs and building certificates on it, and the homes each council’s zoning already allows.
Try the free demo →Measured over the zoning maps of all 128 councils: 70,858,225 hectares zoned, 482,381 of them residential (zones R1 to R5).
Of every hundred hectares NSW’s councils have zoned, this much is zoned residential.
Elsewhere in NSW
Zoning in other councils
How the system works. How land is rezoned · Transport-oriented precincts · All guides →
How we measure. Every zone NSW’s Land Zoning Map draws in Queanbeyan-Palerang Regional Council — the council’s own plan, and the land State planning policies zone directly — as NSW publishes it. Areas are measured from NSW’s outlines; shares are of the land NSW’s map zones, waterways included. Zoned residential means zones R1 to R5, and the older residential zones a few State policies still use.